In order to alleviate the problems with the New Zealand MMP Threshold, a consensus way forward is needed. Two-choice party voting offers that potential consensus. It addresses some of the most important criticisms of the threshold, and makes the voting system much more proportional. And it leaves the threshold percentage unchanged, because there is no consensus on whether or how to change it.
New Zealand has numerous political issues that do not have obvious or easy solutions – housing and covid come to mind.
But there is one problem that can be easily and simply fixed in a way that should please just about everyone. That problem is the MMP threshold and the wasted votes that result.
Many people want to support a minor party, AND want to influence which major part or parties will get to form a government. At present they cannot do both. A vote for a minor party can easily have no effect at all.
The solution comes from realising that the problem is not so much about the existence or level of the threshold. The problem is that if you vote for a party that gets neither 5% or an electorate seat, your vote is wasted. Nobody likes wasting their vote, and so the threshold distorts voter behaviour.
The solution comes from applying the same method that we use in many other situations where we want every person to make a choice, and to still get something if their preferred choice is not available. Yes, you’re onto it. The solution is to give each voter a second choice. “Choose the party you prefer, but declare a second choice in case your preferred option is not available”.
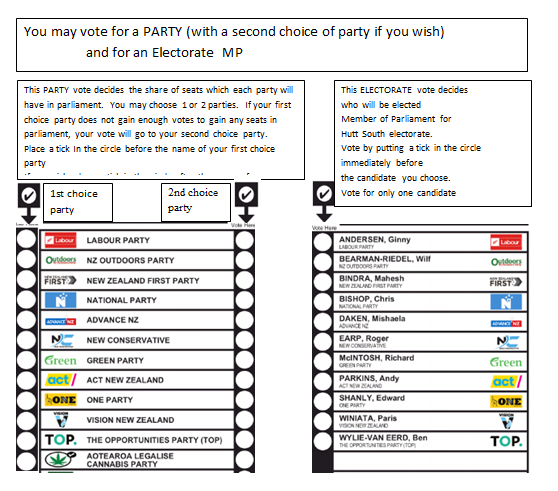
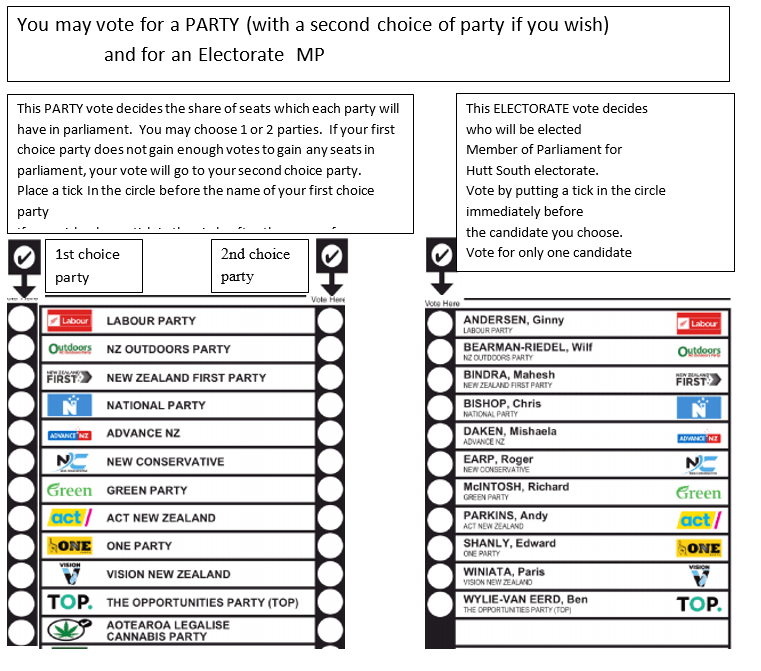
Applying this idea to an MMP election is much easier than you might at first think. First modify the voting paper by adding a second column to the party voting section. Explain to voters that they can give their first choice to any party. If they think that this party might not pass one or other of the thresholds, they can make a second choice in the other column. And if they want to be sure that their vote is not wasted, they make sure that one of their choices is for a party certain to pass a threshold.
At present, perhaps only the two major parties are really safe bets to pass the threshold. But other parties are becoming established. But each voter is free to choose who to vote for.
The voting paper can be very fault tolerant. As long as one or other column has just one tick, the intention is clear. The other column will normally show the other choice, but can be blank or with multiple ticks or whatever.
Vote counting is just a little more complex. Usually it becomes clear early on which parties have passed the threshold. Each polling place can prepare its own result table. Results tables by electorate, region, etc are easily created by grouping the results as required.
From this point on the allocation of seats in parliament proceeds exactly as now.
What would be the result of this modest change to MMP elections? All the anxiety about vote-wasting is gone. Every voter can both choose their preferred party, and be sure that whatever happens they can have a vote that counts. The result is that much more proportional.
There is no problem if either threshold is abolished or changed. If all the thresholds were to be abolished there’d be no need for the second choice.
If only other political problems were as easy to solve as this one.
This solution removes the serious wasted-votes problem that distorts voter behaviour and is often complained about, while retaining the 5% threshold that the major parties seem to place importance on. I am hopeful that it might be a practical, minor and importantly widely acceptable solution.
It decides which parties will be eligible to be allocated seats in parliament.
It allocates those seats in parliament in proportion to (eligible) voter support. BUT Only people who voted for a winning party in step 1 may take part in step 2.
I think that every voter should have a say at step 2.
Two choice party voting does that, without the need to change the threshold percentage or any other aspect of the MMP system.
The 2020 Hutt South voting paper with a second choice column added
The essential issue: The big problem with the MMP threshold is the wasted votes that result. Giving voters a second choice of party vote can virtually eliminate wasted votes, and does not require any change to the threshold.
Yes, the 5% threshold is a very high one. But it is made much more difficult to overcome by the wasted votes that go with the present threshold.
The risk of wasted votes distorts the behaviour of voters, of small parties, and of larger parties. Because wasted votes can change the overall result of an election.
The second choice of party vote eliminates the issue of wasted votes, by making it much easier for voters to avoid wasting their votes. A voter may vote for a small party, but if this party misses the threshold, the voter’s second choice can count.
The present parliamentary inquiry into the 2020 election should consider how to eliminate this serious problem of wasted votes. Two-choice party voting would do it simply and easily.
The size of the threshold, and whether the electorate seat threshold should be retained, are separate issues.
I have just learnt from facebook that the Justice select committee of parliament is holding an inquiry into the 2020 election. This is apparently something routine after each election. Unfortunately the closing date for submissions was 6 April 2021, so I missed it by a week or so.
From what I have read, the problem of wasted votes creates a barrier to participation in the electoral process. In the 2020 election, about 8% of party votes were disregarded because the voter voted for a party that did not pass either of the thresholds, being 5% or an electorate seat.
Young voters are likely to be interested in new ideas and new parties. But we have a system that disenfranchies anybody who votes for a party that does not pass one or other threshold. This disenfranchisement of minor party voters, perhaps mostly young voters, has a discouraging effect on voter participation.
MMP aims to be a proportional system. But bizarrely we have chosen to disenfranchise a small but significant proportion of voters by discarding their votes. This is a severe deficiency in our supposedly proportional electoral system.
And the problem is not one of the size of the threshold. Reducing the threshold would indeed reduce the problem, and eliminating the threshold would eliminate the problem.
But the problem can be better eliminated by giving voters a second choice of party vote. This solution means that every voter can have a say in the makeup of parliament, as well as expressing support for a minor party.
The two-choice system for party voting effectively decouples the size of the threshold from the issue of wasted votes. We can retain MMP with the threshold at whatever level we want, and still have a highly proportional electoral system.
The 5 per cent MMP threshold is regarded by many as the biggest problem in the New Zealand electoral system. This problem remains perhaps because no solution has been found that satisfies two important interest groups. One interest group wants the threshold reduced, because it leads to wasted votes and creates an excessive obstacle to new political parties. But another wants to retain the threshold, because they fear a proliferation of small parties in parliament if the threshold were to be reduced.
There is a solution, one that arises from understanding some nuances of the apparently competing interests. The interest group that wants the threshold reduced appears to be driven mainly by the desire to reduce the wasted votes that arise from a simple threshold. The group that wants to retain the threshold is primarily concerned about avoiding a proliferation of small parties.
Seems to me there’s a deal to be made here. Big parties get to keep the threshold percentage. Small parties get to see an end to most vote wasting.
What is exciting is that there is an easy way to achieve this. Easy to understand, commonly used in the real world, easy to implement, ticks all the boxes.
Yes, the solution is to give each voter a second choice of party vote. If the voter’s first choice party fails to pass the threshold, the vote goes to the second choice party. So most voters would make sure one of their choices was for a party pretty certain to pass the threshold.
This proposal just requires a second party vote column on the party voting paper, and minor changes to vote counting. Once we have totals for each threshold passing party, the existing seat allocation tool works exactly as now.
Just consider the pluses here.
Pressure to reduce the threshold percentage is lowered, making the big, powerful parties more comfortable.
A higher proportion of voters have a say in government formation. We could go from around 92% to easily 99%.
Nobody has to choose between voting for a minor party and abandoning the minor party for a major one so as to have a say in overall government formation.
Minor parties probably get some more votes, because voters do not need to vote strategically, so the threshold seems less distant.
Nobody needs to take into account the risk of wasted votes in any aspect of participation in an election. That makes planning, and cooperation between like minded parties, much easier.
Results would give a better indication of the real support for each party.
The difference between a party just missing and just making the threshold cannot change the coalition-leading party.
It is in many ways better than just reducing the threshold percentage slightly, because it puts a stop to all the perverse effects of wasted votes
So here we have a win-win solution to the long-standing MMP threshold problem. And all at the small price of adding a column to the voting paper and inviting voters to place one more tick if they wish.
This idea may be useful in other MMP systems with thresholds. Offering a second choice can be simply implemented and can help improve proportionality and encourage voters to express their real views.
Here is a mockup of a voting paper modified to provide for a second choice of party vote.
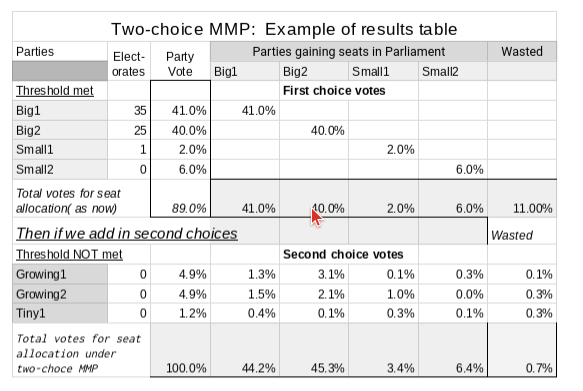
This is what the results table might look like, with the same format for everything between polling place and the whole country.
New Zealand seems to have been barking up the wrong tree for much of the last 25 years looking for a solution to the MMP threshold problem. No good solution has been identified, and MMP review recommendations remain unimplemented.
But there is a very simple, easy to understand solution that keeps the threshold but eliminates the problems.
Give voters a second choice of party vote. If a voter’s first choice party does not pass either threshold, their vote goes to their second choice party. Voters are advised to make one of their choices for a party that is certain to pass one of the thresholds. Nothing else changes.
This solution is easy to understand, easy to implement, and does away with the problems.
Many, perhaps most, voters know which major party they want to see lead the next government. Many also want to support a small party, but cannot know whether that small party will pass a threshold for gaining seats in parliament. If they do not vote for the small party, nobody ever knows they supported it. If they do vote for a small party that misses the threshold, they have no say in government formation. Many voters struggle with this choice every election.
The second-choice system allows voters to clearly state the party they want to see represent them in parliament, but also have a say in government formation if their preferred party does not pass a threshold
The second choice of party vote requires a second column on the party vote part of the voting paper. Once it is clear which parties will pass a threshold, each polling place can prepare its own results table. Results for any grouping of polling places, electorate, region, island, national, specials, overseas, etc are easily obtained by simply adding up the results from the polling places involved.
Ideas like this were suggested by numerous submitters to the 2012 MMP review, and a few described a system in detail. The proposal here is a little different in that it simplifies the allocation of second choices. The message is to choose who you like, for the first choice. If you think this party might not pass the threshold, make a second choice for a party that will pass.
The second choice has the same limitations as the present vote. The vote only counts if it is for a threshold passing party.
This change takes away all the problems with the existing threshold. People can express support for a small party, and play a part in deciding the next government.
Nobody needs to worry that votes for small parties may be wasted. Even if a small party does not pass a threshold, its true level of support is publicly known, and its supporters still have a say in government formation.
This change considerably clears the air for everybody with an interest in the election. Big parties get to keep the threshold they believe is important. No votes need to be wasted. Small parties are still excluded from being allocated seats in parliament, but their votes are recorded and their voters still have a say through their second choice. The big problem of a party just missing the threshold and so changing the lead party in government is gone. The system presents a much lower barrier to entry to small parties, while still preventing a proliferation of small parties in parliament.
The example results table shows a hypothetical situation where two small parties just miss the 5% threshold. With the two-choice system, voters for those small parties have their second choices counted instead.
The problem with the threshold is not so much its size, but the fact that votes, if cast for parties that do not pass one or other treshold, are wasted.
The wasting of votes in this way is widely hated, for well-known reasons.
Reducing but not eliminating the threshold reduces but does not eliminaate this vote wasting effect.
Reducing or eliminating the threshold prejudices the avowed purpose of the threshold – to discourage the proliferation of small parties in parliament.
The solution is one easily understood and widely used in many situations where we want people to make choices, and we want to ensure that almost nobody misses out. That solution is to offer each voter a second choice of party vote.
No need for a complex preferential voting system. Just a second choice eliminates the problems. Voters can vote first choice for their preferrred party, and second choice for a party which they think is certain to pass the threshold. If their first choice does not pass one or other threshold, their vote goes to their second choice.
This is easy to understand, easy to implement, and solves the problem.
When people vote in an MMP election, what is their message?
Some might say:
I would like to see (say) the Maori Party in parliament, but I certainly want a left-leaning government. OR
I would like to see (say) the TOP Party in parliament, but I certainly want a right-leaning government.
I think that many people in NZ see elections in this way. But they cannot vote accordingly.
Unfortunately with the present MMP system, you can only say one of:
I’d like to see (say) the Maori Party in parliament, but I’m worried they may not pass the threshold and then my vote would be wasted, so I will vote Labour because I want a left- leaning government.
I’d like to see (say) the TOP Party in parliament, but I’m worried they may not pass the threshold and then my vote would be wasted, so I will vote National because I want a right-leaning government.
I’d like to see (say) the TOP Party in parliament, but if they miss the threshold, I have no further interest in the result of the election.
I’d like to see (say) the Maori Party in parliament, but if they miss the threshold, I have no further interest in the result of the election.
I think many people choose one of the first two. Getting a government that leans their way is more important than supporting their preferred party.
There are relatively few that have no further interest in the result if their preferred party does not reach the threshold.
I think that many people are not happy with this. They would prefer to be able to express both their support for a preferred party, AND to have a say in which way the elected government leans.
The two-choice party vote system allows voters to express what are common views:
I want to support a smaller party. But if that party does not pass the threshold, I do not want my vote wasted. I want my vote instead to go this other party.
And what is perhaps surprising: this is very easy to do. An extra column on the party voting paper is all that needs to be visible to the voter. The voter can place a tick in that column, if they want to. Vote counting is fractionally more complicated.
But now we have available the options that (I say) most people want.
Imagine receiving a wedding invitation, that says:
We would like to seat you at a table with good company. So please say which table you would like to sit at for the Wedding Breakfast
We will have a few larger tables, including one for his family and family friends, one for her family and family friends.
There may be some smaller tables, for special groups. Possibly a table for her work friends, one for his work friends, one for people from their gym, and one for their cycling friends. But we will only have each of those smaller tables if there are enough people wanting to sit there.
If you choose one of the smaller tables, but there are not enough people to fill it, we won’t have a table for that group at all and we will cancel your invite.
Whoa you say, that is not very friendly.
It would be more friendly and normal to say:
If you choose one of the smaller tables, but there are not enough people to fill it, we will place you at one of the larger tables. Please say which you would prefer, with his family or her family.
That demonstrates the difference between the present and proposed MMP systems. If you can’t give someone what they would prefer, do not reject them entirely, as at present. it is better to offer them a second choice.